

4 min read

What is a yield curve, and why are stock investors interested in its shape?
A yield curve gives a snapshot of how yields vary across bonds of similar credit quality, but different maturities, at a specific point in time. For example, the US Treasury yield curve indicates the yields of US Treasury bonds across a range of maturities. Bond yields change as markets digest news and events around the world, which also causes yield curves to move and change shape over time.
Exhibit 1 includes snapshots of the US Treasury yield curve on the last trading day of September for the last three years. Rates across the entire curve have generally moved higher since 2016. However, short-term rates moved at a faster pace than long-term rates leading to a “flattening” of the slope of the yield curve.
Historically, yield curves have mostly been upwardly sloping (short-term rates lower than long-term rates), but there have also been several periods when the yield curve has either been flat or inverted. One question often posed by investors is whether inverted yield curves predict a future stock market decline. While the handful of instances of curve inversions in the US may concern investors, the small number of examples makes it difficult to determine a strong connection, and evidence from around the world suggests investors should not extrapolate from the US experience.
Exhibit 1. The US Yield Curve Has Flattened in 2018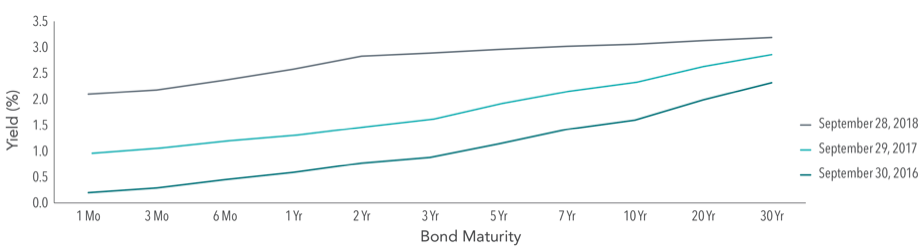
US Treasury yield curve data (monthly) obtained from US Department of the Treasury website. Past performance is no guarantee of future results.
The US Market
Exhibit 2 illustrates growth of a hypothetical $1,000 investment in the S&P 500 Index since June 1976 plotted against the difference between 10-year and 2-year Treasury yields. This difference is referred to as the term spread[1] and is a commonly used measure of yield curve steepness. Also marked on the chart are the onset of the four periods when the yield curve inverted for at least two consecutive months, and short-term rates began to exceed long-term rates.
Exhibit 2. Relation Between Yield Curve Inversions and US Stock Market Performance
Monthly Data: June 1976–September 2018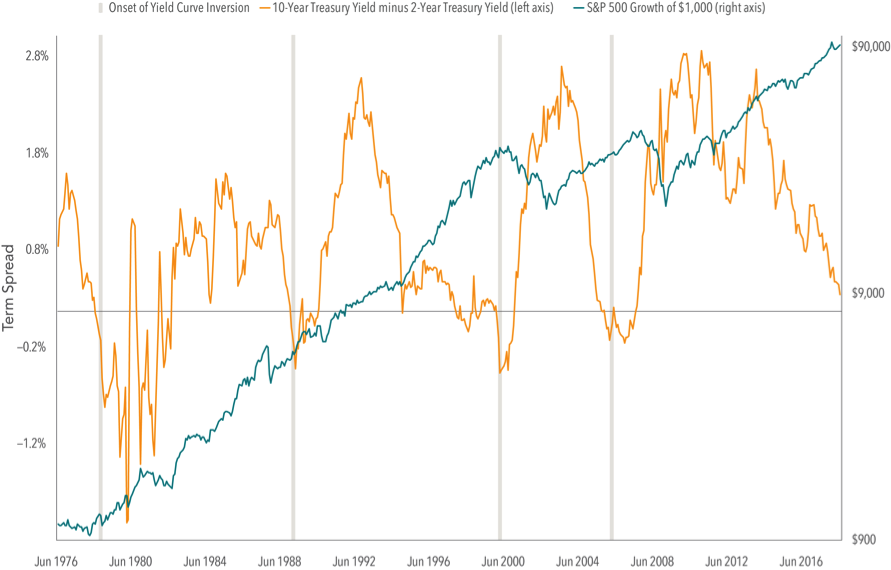
US Treasury yield curve data (monthly) obtained from FRED, Federal Reserve Bank of St. Louis. S&P 500 Index © 2018 S&P Dow Jones Indices LLC, a division of S&P Global. All rights reserved. Indices are not available for direct investment. Their performance does not reflect the expenses associated with the management of an actual portfolio. Past performance is no guarantee of future results.
[1]. Term spread is the yield difference between bonds with different maturities but similar credit quality.
The inversion prior to the 2008 financial crisis is interesting to review. The US yield curve inverted in December 2005, after which the S&P 500 Index posted a positive 12-month return. The yield curve’s slope became positive again in June 2007, well prior to the market’s major downturn from October 2007 through February 2009. If an investor had interpreted the inversion as a sign of an imminent market decline, being out of stocks during the inverted period could have resulted in missing out on stock market gains. And if the same investor bought additional stock once the curve’s slope became positive, they would also have been exposed to the stock market weakness that followed.
Though the data set is limited, an analysis of yield curve inversions shows that an inversion may not be a reliable indicator of stock market downturns. So, what can investors do if they are concerned about potential equity weakness? By developing and sticking to a long-term plan that is in line with their risk tolerance, investors may be better able to look past short-term noise and focus on investing in a systematic way that will help meet long-term goals.
As always, we’re here to help. We would love to talk if you have any questions.
|
Source: Dimensional Fund Advisors LP. Indices are not available for direct investment. Their performance does not reflect the expenses associated with the management of an actual portfolio. Past performance is not a guarantee of future results. Diversification does not eliminate the risk of market loss. There is no guarantee investment strategies will be successful. Investing involves risks, including possible loss of principal. Investors should talk to their financial advisor prior to making any investment decision. There is always the risk that an investor may lose money. A long-term investment approach cannot guarantee a profit. All expressions of opinion are subject to change. This article is distributed for informational purposes, and it is not to be construed as an offer, solicitation, recommendation, or endorsement of any particular security, products, or services. Investors should talk to their financial advisor prior to making any investment decision. |
Related Posts
The Road Beyond: What to Do First When Grief is Fresh
“A journey of a thousand miles begins with a single step.” -Laozi
Your Wealth Journey Investment Insights: Why Financial Market Prices Change & Why You Should Care
If you’ve ever been to Seattle, you probably visited Pike’s Place Market. Maybe you even...
The Dow at 20,000 and What That Means for You
Just a few weeks ago, people were feeling nervous about how the election would cause the market to...